
Page 1225 - TNFlipTest
P. 1225
Toronto Notes 2019 Determinants of Health
■ to minimize biases and harms, and maximize benefits, screening is best done at the population level, not the individual clinical level, as part of a screening program (e.g. Provincial breast cancer screening program vs. screening by primary care/family physicians)
• typesofscreening
■ universal screening: screening all members of a population for a disease (e.g. phenylketonuria
(PKU) and hypothyroidism in all newborns)
■ selectivescreening:screeningoftargetedsubgroupsofthepopulationatriskforadisease(e.g.
mammography in women >50 yr old)
■ multiphasicscreening:theuseofmanymeasurementsandinvestigationstolookformanydisease
entities (e.g. periodic health exam)
• typesofbiasinscreening
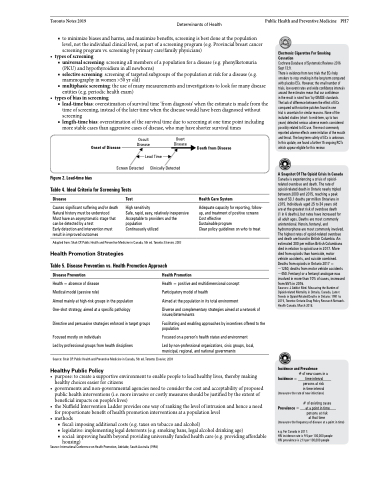
■ lead-timebias:overestimationofsurvivaltime‘fromdiagnosis’whentheestimateismadefromthe
time of screening, instead of the later time when the disease would have been diagnosed without
screening
■ length-time bias: overestimation of the survival time due to screening at one time point including
more stable cases than aggressive cases of disease, who may have shorter survival times
Public Health and Preventive Medicine PH7
Onset of Disease
Occult Disease
Overt Disease
Death from Disease
Health Care System
Adequate capacity for reporting, follow- up, and treatment of positive screens Cost effective
Sustainable program
Clear policy guidelines on who to treat
Electronic Cigarettes For Smoking Cessation
Cochrane Database of Systematic Reviews 2016 Sept 13;9.
There is evidence from two trials that ECs help smokers to stop smoking in the long term compared with placebo ECs. However, the small number of trials, low event rates and wide confidence intervals around the estimates mean that our confidence
in the result is rated ‘low’ by GRADE standards.
The lack of difference between the effect of ECs compared with nicotine patches found in one
trial is uncertain for similar reasons. None of the included studies (short- to mid-term, up to two years) detected serious adverse events considered possibly related to EC use. The most commonly reported adverse effects were irritation of the mouth and throat. The long-term safety of ECs is unknown. In this update, we found a further 15 ongoing RCTs which appear eligible for this review.
A Snapshot Of The Opioid Crisis In Canada
Canada is experiencing a crisis of opioid- related overdose and death. The rate of opioid-related death in Ontario nearly tripled between 2000 and 2015, reaching a peak
rate of 53.1 deaths per million Ontarians in 2015. Individuals aged 25 to 34 years old
are at the greatest risk of overdose death
(1 in 6 deaths), but rates have increased for all adult ages. Deaths are most commonly unintentional. Heroin, fentanyl, and hydromorphone are most commonly involved. The highest rates of opioid-related overdose and death are found in British Columbia. An estimated 300 per million British Columbians died in relation to opioid use in 2017. More died from opioids than homicide, motor vehicle accidents, and suicide combined. Deaths from opioids in Ontario 2017 = ~1250, deaths from motor vehicle accidents ~450. Fentanyl or a fentanyl analogue was involved in more than 70% of cases, increased from 55% in 2016.
Sources: J Addict Med. Measuring the Burden of Opioid-related Mortality in Ontario, Canada. Latest Trends in Opioid-Related Deaths in Ontario: 1991 to 2015, Toronto: Ontario Drug Policy Research Network. Health Canada. March 2018.
Incidence and Prevalence
Screen Detected
Figure 2. Lead-time bias
Table 4. Ideal Criteria for Screening Tests
Lead Time
Clinically Detected
Disease
Causes significant suffering and/or death Natural history must be understood Must have an asymptomatic stage that can be detected by a test
Early detection and intervention must result in improved outcomes
Test
High sensitivity
Safe, rapid, easy, relatively inexpensive Acceptable to providers and the population
Continuously utilized
Adapted from: Shah CP. Public Health and Preventive Medicine in Canada, 5th ed. Toronto: Elsevier, 2003
Health Promotion Strategies
Table 5. Disease Prevention vs. Health Promotion Approach
Disease Prevention
Health = absence of disease
Medical model (passive role)
Aimed mainly at high-risk groups in the population One-shot strategy, aimed at a specific pathology
Directive and persuasive strategies enforced in target groups
Focused mostly on individuals
Led by professional groups from health disciplines
Health Promotion
Source: International Conference on Health Promotion, Adelaide, South Australia (1998)
Health = positive and multidimensional concept
Participatory model of health
Aimed at the population in its total environment
Diverse and complementary strategies aimed at a network of issues/determinants
Facilitating and enabling approaches by incentives offered to the population
Focused on a person’s health status and environment
Led by non-professional organizations, civic groups, local, municipal, regional, and national governments
Source: Shah CP. Public Health and Preventive Medicine in Canada, 5th ed. Toronto: Elsevier, 2003
Healthy Public Policy
• purpose:tocreateasupportiveenvironmenttoenablepeopletoleadhealthylives,therebymaking healthy choices easier for citizens
• governments and non-governmental agencies need to consider the cost and acceptability of proposed public health interventions (i.e. more invasive or costly measures should be justified by the extent of beneficial impacts on people’s lives)
• theNuffieldInterventionLadderprovidesonewayofrankingthelevelofintrusionandhenceaneed for proportionate benefit of health promotion interventions at a population level
• methods
■ fiscal: imposing additional costs (e.g. taxes on tobacco and alcohol)
■ legislative: implementing legal deterrents (e.g. smoking bans, legal alcohol drinking age)
■ social: improving health beyond providing universally funded health care (e.g. providing affordable
housing)
#ofnewcasesina time interval persons at risk in time interval
Incidence =
(measures the rate of new infections)
# of existing cases at a point in time persons at risk
Prevalence =
(measures the frequency of disease at a point in time)
e.g. For Canada in 2011:
HIV incidence rate is 9.5 per 100,000 people HIV prevalence is 213 per 100,000 people
at that time
