
Page 1229 - TNFlipTest
P. 1229
Toronto Notes 2019 Epidemiology Interpreting Test Results
Public Health and Preventive Medicine PH11
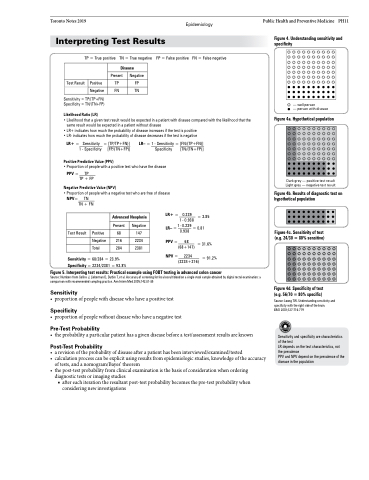
Figure 4. Understanding sensitivity and specificity
— well person
— person with disease
Figure 4a. Hypothetical population
Dark grey — positive test result Light grey — negative test result
Figure 4b. Results of diagnostic test on hypothetical population
Figure 4c. Sensitivity of test (e.g. 24/30 = 80% sensitive)
Figure 4d. Specificity of test
(e.g. 56/70 = 80% specific)
Source: Loong TW. Understanding sensitivity and specificity with the right side of the brain.
BMJ 2003;327:716-719
Sensitivity and specificity are characteristics of the test
LR depends on the test characteristics, not the prevalence
PPV and NPV depend on the prevalence of the disease in the population
TP = True positive
Sensitivity = TP/(TP+FN) Specificity = TN/(TN+FP)
Likelihood Ratio (LR)
TN = True negative
FP = False positive
FN = False negative
Disease
Present
Negative
Test Result
Positive
TP
FP
Negative
FN
TN
• Likelihood that a given test result would be expected in a patient with disease compared with the likelihood that the same result would be expected in a patient without disease
• LR+ indicates how much the probability of disease increases if the test is positive • LR- indicates how much the probability of disease decreases if the test is negative
LR+ = Sensitivity = [TP/TP+FN)] LR– = 1 - Sensitivity = [FN/(TP+FN)]
1 - Specificity [FP/(TN+FP)] Specificity
Positive Predictive Value (PPV)
• Proportion of people with a positive test who have the disease
PPV= TP TP + FP
Negative Predictive Value (NPV)
• Proportion of people with a negative test who are free of disease
NPV= TN TN + FN
Sensitivity = 68/284 = 23.9%
Specificity = 2234/2381 = 93.8%
[TN/(TN+FP)]
LR+ =
LR– =1 - 0.239 = 0.81
0.239 = 3.85 1 - 0.938
Advanced Neoplasia
Present
Negative
Test Result
Positive
68
147
Negative
216
2234
Total
284
2381
0.938
PPV = 68 (68+147)
= 31.6%
NPV = 2234 (2234+216)
= 91.2%
Figure 5. Interpreting test results: Practical example using FOBT testing in advanced colon cancer
Source: Numbers from Collins J, Lieberman D, Durbin T, et al. Accuracy of screening for fecal occult blood on a single stool sample obtained by digital rectal examination: a comparison with recommended sampling practice. Ann Intern Med 2005;142:81-85
Sensitivity
• proportionofpeoplewithdiseasewhohaveapositivetest
Specificity
• proportionofpeoplewithoutdiseasewhohaveanegativetest
Pre-Test Probability
• theprobabilityaparticularpatienthasagivendiseasebeforeatest/assessmentresultsareknown
Post-Test Probability
• arevisionoftheprobabilityofdiseaseafterapatienthasbeeninterviewed/examined/tested
• calculationprocesscanbeexplicitusingresultsfromepidemiologicstudies,knowledgeoftheaccuracy
of tests, and a nomogram/Bayes’ theorem
• thepost-testprobabilityfromclinicalexaminationisthebasisofconsiderationwhenordering
diagnostic tests or imaging studies
■ after each iteration the resultant post-test probability becomes the pre-test probability when
considering new investigations
