
Page 1230 - TNFlipTest
P. 1230
PH12 Public Health and Preventive Medicine Epidemiology Toronto Notes 2019
PRE - TEST PROBABILITY
POST - TEST PROBABILITY
0.999
0.998 0.997
0.995 0.993 0.99
0.98
0.97
0.95 0.93 0.9
0.8 0.7
0.6 0.5 0.4 0.3
0.2
0.1 0.07 0.05
0.03 0.02
0.01 0.007 0.005
0.003 0.002
0.001
Effectiveness of Interventions
Effectiveness, Efficacy, Efficiency
0.001
0.002 0.003
0.005 0.007 0.01
0.02 0.03
0.05 0.07 0.1
0.2
0.3 0.4 0.5 0.6 0.7
0.8
0.9 0.93 0.95
0.97 0.98
0.99 0.993 0.995
0.997 0.998
0.999
LIKELIHOOD RATIO
1000 500
200 100 50 20 150
2
1 0.5
0.2
0.1 0.05
•
• •
•
three measurements indicating the relative value (beneficial effects vs. harmful effects) of an intervention
■ efficacy: the extent to which a specific intervention produces a beneficial result under ideal conditions (e.g. RCT)
idealconditionsincludeadherence,closemonitoring,accesstohealthresources,etc.
■ effectiveness: measures the benefit of an intervention under usual conditions of clinical care
considers both the efficacy of an intervention and its actual impact on the real world, taking into account access to the intervention, whether it is offered to those who can benefit from it, its proper administration, acceptance of intervention, and degree of adherence to intervention
■ efficiency: a measure of economy of an intervention with known effectiveness considerstheoptimaluseofresources(e.g.money,time,personnel,equipment,etc.)
Disease (e.g. lung CA)
Present
Absent
Total
Present
A
B
A+B
Absent
C
D
C+D
Total
A+C
B+D
A+B+C+D
0.02
Exposure
(e.g. smoking)
Case-Control Study
0.01 0.005
0.003 0.001
oddsratio(OR)*= A ÷ B = A×D CDB×C
Cohort Study
©Naveen Devasagayam 2016
= incidence rate of health outcome in non-exposed
relativerisk = A ÷ C attributablerisk = A C (RR)** A+B C+D (AR)*** A+B C+D
*Ratio of the odds in favour of the health outcome among the exposed to the odds in favour among the unexposed **Ratio of the risk of a health outcome among exposed to the risk among the unexposed
***Rate of health outcome in exposed individuals that can be attributed to the exposure
C A+B C+D
A = incidence rate of health outcome in exposed
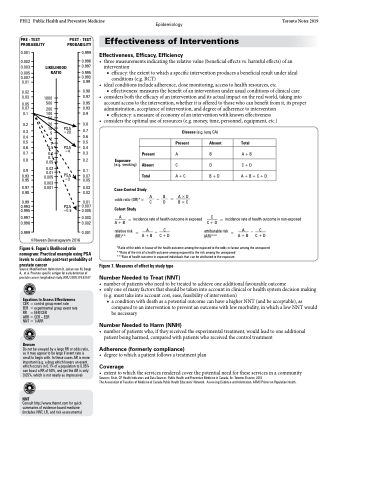
Figure 6. Fagan’s likelihood ratio nomogram: Practical example using PSA levels to calculate post-test probability of
prostate cancer
Source: Modified from Holmstrom B, Johansson M, Bergh A, et al. Prostate specific antigen for early detection of prostate cancer: longitudinal study. BMJ 2009;339:b3537
Equations to Assess Effectiveness
CER = control group event rate
EER = experimental group event rate RR = EER/CER
ARR=CER–EER
NNT = 1/ARR
Beware
Do not be swayed by a large RR or odds ratio, as it may appear to be large if event rate is small to begin with. In these cases AR is more important (e.g. a drug which lowers an event which occurs in 0.1% of a population to 0.05% can boast a RR of 50%, and yet the AR is only 0.05%, which is not nearly as impressive)
NNT
Consult http://www.thennt.com for quick summaries of evidence-based medicine (includes NNT, LR, and risk assessments)
Figure 7. Measures of effect by study type
Number Needed to Treat (NNT)
• numberofpatientswhoneedtobetreatedtoachieveoneadditionalfavourableoutcome
• onlyoneofmanyfactorsthatshouldbetakenintoaccountinclinicalorhealthsystemdecisionmaking
(e.g. must take into account cost, ease, feasibility of intervention)
■ a condition with death as a potential outcome can have a higher NNT (and be acceptable), as
compared to an intervention to prevent an outcome with low morbidity, in which a low NNT would be necessary
Number Needed to Harm (NNH)
• numberofpatientswho,iftheyreceivedtheexperimentaltreatment,wouldleadtooneadditional patient being harmed, compared with patients who received the control treatment
Adherence (formerly compliance)
• degreetowhichapatientfollowsatreatmentplan
Coverage
• extenttowhichtheservicesrenderedcoverthepotentialneedfortheseservicesinacommunity
Sources: Shah, CP. Health Indicators and Data Sources. Public Health and Preventive Medicine in Canada, 5e. Toronto: Elsevier, 2003 TheAssociationofFacultiesofMedicineofCanadaPublicHealthEducators’Network. AssessingEvidenceandInformation.AFMCPrimeronPopulationHealth.
PSA =20
PSA =4
PSA =3
PSA =0.5
