
Page 1234 - TNFlipTest
P. 1234
PH16 Public Health and Preventive Medicine Methods of Analysis Toronto Notes 2019
Consult the Cochrane Library of Systematic Reviews (http://www.cochranelibrary.com) for high-quality systematic reviews and meta-analyses
Example Calculation
Data set: 17, 14, 17, 10, 7 Mean=(17+14+17+10+7)
÷5=13
Median (write the list in order, median is the number in the middle) =7,10,14,17,17=14
Mode (number repeated more often) = 17 Range=17-7=10
Variance = [(17 – 13)2 + (14 – 13)2
+(17–13)2 +(10–13)2
+(7–13)2]÷4=19.5 Standard Deviation = √variance = √19.5
Disadvantages
• studiesmaybeheterogenousandthereforeinappropriatetocombine(e.g.differentpatientpopulations, exposure classification/measurement, outcome assessment)
• relianceonpublishedstudiesmayincreasethepotentialconclusionofaneffectasitcanbedifficultto
publish studies that show no significant results (publication bias)
Sources: Shah, CP. Measurement and Investigation. Public Health and Preventive Medicine in Canada, 5e. Toronto: Elsevier, 2003. TheAssociationofFacultiesofMedicineofCanadaPublicHealthEducators’Network. AssessingEvidenceandInformation.AFMCPrimeronPopulationHealth.
Methods of Analysis
Distributions
• adistributiondescribesthefrequencyatwhicheachvalue(orcategory)occursinastudypopulation • distributions can take characteristic shapes. i.e., normal (Gaussian) or non-normal (binomial, gamma,
skewed, etc.)
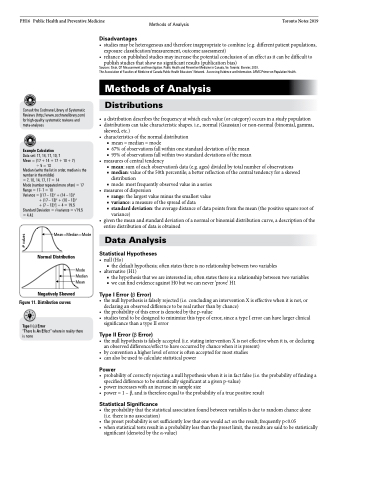
• characteristicsofthenormaldistribution
■ mean=median=mode
■ 67% of observations fall within one standard deviation of the mean ■ 95% of observations fall within two standard deviations of the mean
• measures of central tendency
■ mean:sumofeachobservation’sdata(e.g.ages)dividedbytotalnumberofobservations
■ median:valueofthe50thpercentile;abetterreflectionofthecentraltendencyforaskewed
distribution
■ mode: most frequently observed value in a series
• measures of dispersion
■ range: the largest value minus the smallest value
■ variance:ameasureofthespreadofdata
■ standarddeviation:theaveragedistanceofdatapointsfromthemean(thepositivesquarerootof
variance)
• giventhemeanandstandarddeviationofanormalorbinomialdistributioncurve,adescriptionofthe
entire distribution of data is obtained
Data Analysis
Statistical Hypotheses
• null(Ho)
■ the default hypothesis; often states there is no relationship between two variables
• alternative(H1)
■ the hypothesis that we are interested in; often states there is a relationship between two variables ■ we can find evidence against H0 but we can never ‘prove’ H1
Type I Error (β Error)
• thenullhypothesisisfalselyrejected(i.e.concludinganinterventionXiseffectivewhenitisnot,or
declaring an observed difference to be real rather than by chance)
• theprobabilityofthiserrorisdenotedbythep-value
• studiestendtobedesignedtominimizethistypeoferror,sinceatypeIerrorcanhavelargerclinical
significance than a type II error
Type II Error (β Error)
• thenullhypothesisisfalselyaccepted(i.e.statinginterventionXisnoteffectivewhenitis,ordeclaring
an observed difference/effect to have occurred by chance when it is present)
• byconventionahigherleveloferrorisoftenacceptedformoststudies
• canalsobeusedtocalculatestatisticalpower
Power
• probabilityofcorrectlyrejectinganullhypothesiswhenitisinfactfalse(i.e.theprobabilityoffindinga specified difference to be statistically significant at a given p-value)
• powerincreaseswithanincreaseinsamplesize
• power=1–β,andisthereforeequaltotheprobabilityofatruepositiveresult
Statistical Significance
• theprobabilitythatthestatisticalassociationfoundbetweenvariablesisduetorandomchancealone (i.e. there is no association)
• thepresetprobabilityissetsufficientlylowthatonewouldactontheresult;frequentlyp<0.05
• whenstatisticaltestsresultinaprobabilitylessthanthepresetlimit,theresultsaresaidtobestatistically
significant (denoted by the α-value)
= 4.42
Mean=Median=Mode
Normal Distribution
Mode Median Mean
Negatively Skewed Figure 11. Distribution curves
Type I (α) Error
“There Is An Effect” where in reality there is none
# values
