
Page 1235 - TNFlipTest
P. 1235
Toronto Notes 2019 Methods of Analysis Public Health and Preventive Medicine PH17
Clinical Significance
• measureofclinicalusefulness(e.g.1mmHgBPreductionmaybestatisticallysignificant,butmaynot be clinically significant)
• dependsonfactorssuchascost,availability,patientcompliance,andsideeffectsinadditiontostatistical significance
Confidence Interval (CI)
• providesarangeofvalueswithinwhichthetruepopulationresult(e.g.themean)lies,boundedbythe upper and lower confidence limits
• frequentlyreportedas95%CI(i.e.ifthisstudywererepeated100times,estimateswouldfallwithinthe 95% CI 95 out of 100 times)
Data
• informationcollectedfromasampleofapopulation
• thereare4overalllevelsofmeasurementforquantitativedata
■ categorical (e.g. blood type, marital status)
■ ordinal (e.g. low, medium, high)
■ interval (e.g. °C, time of day)
■ ratio (e.g. serum cholesterol, hemoglobin, age)
Validity/Accuracy (of a measurement tool)
• howcloselyameasurementreflectstheentityitclaimstomeasure
Reliability/Precision
• howconsistentmultiplemeasurementsarewhentheunderlyingsubjectofmeasurementhasnot changed
• maybeassessedbydifferentobserversatthesametime(inter-raterreliability)orbythesameobserver under different conditions (test-retest reliability)
Internal Validity
• degreetowhichthefindingsofthesampletrulyrepresentthefindingsinthestudypopulation • dependentonthereliability,accuracy,andabsenceofotherbiases
External Validity (i .e . Generalizability)
• degreetowhichtheresultsofthestudycanbegeneralizedtoothersituationsorpopulations
A wider confidence interval implies more variance than a tighter confidence interval given the same critical value
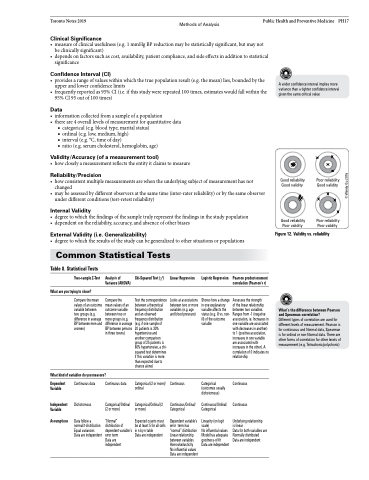
Good reliability Good validity
Good reliability Poor validity
Poor reliability Good validity
Poor reliability Poor validity
Common Statistical Tests
Figure 12. Validity vs. reliability
What’s the difference between Pearson and Spearman correlation?
Different types of correlation are used for different levels of measurement. Pearson is for continuous and Normal data, Spearman is for ordinal or non-Normal data. There are other forms of correlation for other levels of measurement (e.g. Tetrachoric/polychoric)
Table 8. Statistical Tests
Two-sample Z-Test
What are you trying to show?
Compare the mean values of an outcome variable between two groups (e.g. difference in average BP between men and women)
Analysis of Variance (ANOVA)
Compare the
mean values of an outcome variable between two or more groups (e.g. difference in average BPbetweenpersons in three towns)
Chi-Squared Test (χ2)
Test the correspondence between a theoretical frequency distribution and an observed frequency distribution (e.g. if one sample of 20patientsis30% hypertensive and another comparison group of 25 patients is 60% hypertensive, a chi- squared test determines if this variation is more than expected due to chance alone)
Categorical (2 or more)/ ordinal
Categorical/Ordinal (2 or more)
Expected counts must beatleast5forallcells in n by n table
Data are independent
Linear Regression
Looks at associations between two or more variables (e.g. age and blood pressure)
Continuous
Continuous/Ordinal/ Categorical
Dependent variable’s error termhas “normal” distribution Linear relationship between variables Homoskedasticity No influential values Data are independent
Logistic Regression
Shows how a change in one explanatory variable affects the status (e.g. ill vs. non- ill) of the outcome variable
Categorical (outcomes usually dichotomous)
Continuous/Ordinal/ Categorical
Linearity (on logit scale)
No influential values Model has adequate goodness-of-fit
Data are independent
Pearson product-moment correlation (Pearson’s r)
Assesses the strength
of the linear relationship between two variables. Ranges from -1 (negative association, ie. Increases in one variable are associated withdecreasesinanother) to 1 (positive association, increases in one variable are associated with increases in the other). A correlation of 0 indicates no relationship
Continuous
Continuous
Underlying relationship islinear
Data for both variables are Normally distributed
Data are independent
What kind of variables do you measure?
Dependent Variable
Independent Variable
Assumptions
Continuous data
Dichotomous
Data follow a normal/t-distribution Equal variances Data are independent
Continuous data
Categorical/Ordinal (2 or more)
“Normal” distributionof dependent variable’s error term
Data are independent
©Wendy Gu 2016
