
Page 1237 - TNFlipTest
P. 1237
Toronto Notes 2019 Health Services Research Public Health and Preventive Medicine PH19
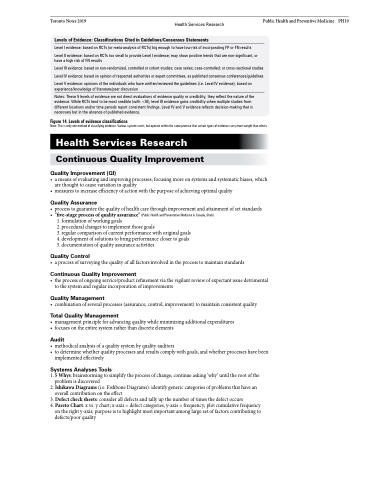
Levels of Evidence: Classifications Cited in Guidelines/Consensus Statements
Level I evidence: based on RCTs (or meta-analysis of RCTs) big enough to have low risk of incorporating FP or FN results
Level II evidence: based on RCTs too small to provide Level I evidence; may show positive trends that are non-significant, or have a high risk of FN results
Level III evidence: based on non-randomized, controlled or cohort studies; case series; case-controlled; or cross-sectional studies Level IV evidence: based on opinion of respected authorities or expert committees, as published consensus conferences/guidelines
Level V evidence: opinions of the individuals who have written/reviewed the guidelines (i.e. Level IV evidence), based on experience/knowledge of literature/peer discussion
Notes: These 5 levels of evidence are not direct evaluations of evidence quality or credibility; they reflect the nature of the evidence. While RCTs tend to be most credible (with <III), level III evidence gains credibility when multiple studies from different locations and/or time periods report consistent findings. Level IV and V evidence reflects decision-making that is necessary but in the absence of published evidence.
Figure 14. Levels of evidence classifications
Note: This is only one method of classifying evidence. Various systems exist, but operate within the same premise that certain types of evidence carry more weight than others
Health Services Research
Continuous Quality Improvement
Quality Improvement (QI)
• ameansofevaluatingandimprovingprocesses;focusingmoreonsystemsandsystematicbiases,which are thought to cause variation in quality
• measurestoincreaseefficiencyofactionwiththepurposeofachievingoptimalquality
Quality Assurance
• processtoguaranteethequalityofhealthcarethroughimprovementandattainmentofsetstandards • “five-stageprocessofqualityassurance”(PublicHealthandPreventativeMedicineinCanada,Shah)
1. formulation of working goals
2. procedural changes to implement those goals
3. regular comparison of current performance with original goals 4. development of solutions to bring performance closer to goals 5. documentation of quality assurance activities
Quality Control
• aprocessofsurveyingthequalityofallfactorsinvolvedintheprocesstomaintainstandards
Continuous Quality Improvement
• theprocessofongoingservice/productrefinementviathevigilantreviewofexpectantissuedetrimental to the system and regular incorporation of improvements
Quality Management
• combinationofseveralprocesses(assurance,control,improvement)tomaintainconsistentquality
Total Quality Management
• managementprincipleforadvancingqualitywhileminimizingadditionalexpenditures • focusesontheentiresystemratherthandiscreteelements
Audit
• methodicalanalysisofaqualitysystembyqualityauditors
• todeterminewhetherqualityprocessesandresultscomplywithgoals,andwhetherprocesseshavebeen
implemented effectively
Systems Analyses Tools
1. 5 Whys: brainstorming to simplify the process of change; continue asking ‘why’ until the root of the problem is discovered
2. Ishikawa Diagrams (i.e. Fishbone Diagrams): identify generic categories of problems that have an overall contribution on the effect
3. Defect check sheets: consider all defects and tally up the number of times the defect occurs
4. Pareto Chart: x vs. y chart; x-axis = defect categories, y-axis = frequency; plot cumulative frequency on the right y-axis; purpose is to highlight most important among large set of factors contributing to
defects/poor quality
