
Page 996 - TNFlipTest
P. 996
OT10 Otolaryngology
Hearing
Toronto Notes 2019
Frequency of Tuning Fork (Hz)
256 512 1024
Minimum Hearing Loss for Rinne to Reverse (BC>AC, NEGATIVE Rinne) (dB)
15 30 45
Table 4. The Interpretation of Tuning Fork Tests
Examples
Normal or bilateral SNHL
Right-sided CHL, normal left ear
Right-sided SNHL, normal left ear
Right-sided severe SNHL or dead right ear, normal left ear
Weber
Central Lateralizes to right Lateralizes to left Lateralizes to left
Rinne
AC>BC (+) bilaterally BC>AC (–) right AC>BC (+) bilaterally BC>AC (–) right*
Range of Frequencies Audible to Human Ear
• 20to20000Hz
• Most sensitive frequencies: 1000 to 4000 Hz • Range of human speech: 500 to 2000 Hz
Hearing loss most often occurs at higher frequencies. Noise-induced (occupational) HL is classically seen at 4000 Hz. HL associated with otosclerosis is seen at 2000 Hz (Carhart’s notch)
*A vibrating tuning fork on the mastoid stimulates the cochlea bilaterally, therefore in this case the left cochlea is stimulated by the Rinne test on the right (e.g. a false negative test). These tests are not valid if the ear canals are obstructed with cerumen (e.g. will create conductive loss)
Pure Tone Audiometry
• athresholdisthelowestintensitylevelatwhichapatientcanhearthetone50%ofthetime
• thresholds are obtained for each ear at frequencies of 250, 500, 1000, 2000, 4000, and 8000 Hz
• airconductionthresholdsareobtainedwithheadphonesandmeasureouter,middle,innerear,and
auditory nerve function
• boneconductionthresholdsareobtainedwithboneconductionoscillatorswhichbypasstheouterand
middle ear
Degree of Hearing Loss
• determinedonbasisofthepuretoneaverage(PTA)at500,1000,and2000Hz
250 500 1000 2000 4000 8000 -10
10 20 30 40 50 60 70 80 90
100 110
B. Conductive Hearing 120 Loss (Otitis Media)
250 500 1000 2000 4000 8000 -10
FREQUENCY (Hz)
250 500 1000 2000 4000 8000
Audiogram Legend
for a Left Ear -10 x= AC Unmasked 10 >= BC Unmasked 20 = AC Masked 30
]= BC Masked 40 50 60 70 80 90 100 110
A. Normal Audiogram 120 250 500 1000 2000 4000 8000 250 500 1000 2000
4000 8000 -10
-10 000
10 10 10
20 20 30 30 40 40 50 50 60 60 70 70 80 80 90 90
100 100 110 110
C. Conductive Hearing 120 D. Sensorineural 120 Loss (Otosclerosis) Hearing Loss
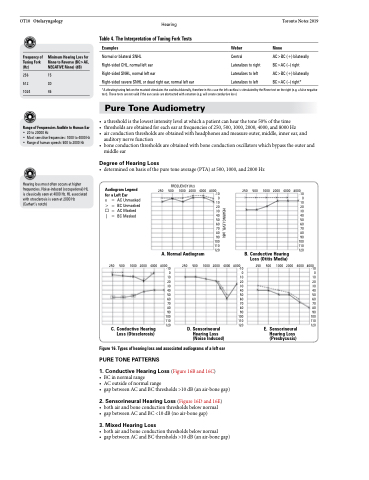
(Noise Induced) Figure 16. Types of hearing loss and associated audiograms of a left ear
PURE TONE PATTERNS
1 . Conductive Hearing Loss (Figure 16B and 16C)
• BCinnormalrange
• ACoutsideofnormalrange
• gapbetweenACandBCthresholds>10dB(anair-bonegap)
2 . Sensorineural Hearing Loss (Figure 16D and 16E) • bothairandboneconductionthresholdsbelownormal
• gapbetweenACandBC<10dB(noair-bonegap)
3 . Mixed Hearing Loss
• bothairandboneconductionthresholdsbelownormal
• gapbetweenACandBCthresholds>10dB(anair-bonegap)
20 30 40 50 60 70 80 90
100 110
E. Sensorineural 120 Hearing Loss (Presbycusis)
HEARING LEVEL (dB)
