
Page 251 - TNFlipTest
P. 251
Toronto Notes 2019 Disorders of Glucose Metabolism
Diet
• dailycarbohydrateintake45-60%ofenergy,protein15-20%ofenergy,andfat<35%ofenergy • intakeofsaturatedfats<7%andpolyunsaturatedfats<10%oftotalcalorieseach
• limitsodium,alcohol,andcaffeineintake
• Type1:carbohydratecountingisusedtotitrateprandialinsulindose
• Type2:weightreductiontohelpcontrolbloodglucoselevels
Lifestyle
• regularphysicalexercisetoimproveinsulinsensitivity,lowerlipidconcentrations,andcontrolblood pressure
• smokingcessation
Medical Treatment: Non-Insulin Antihyperglycemic Agents (Type 2 DM)
• initiatenon-insulinantihyperglycemictherapywithin2-3moiflifestylemanagementdoesnotresultin glycemic control
• if initial HbA1c >8.5% at the time of diagnosis, initiate pharmacologic therapy with metformin immediately, and consider combination of therapies or insulin immediately
• continuetoaddadditionalpharmacologictherapyinatimelyfashiontoachievetargetHbA1Cwithin 3-6 mo of diagnosis
• seeCommonMedications,E50fordetailsonantihyperglycemicagents
Medical Treatment: Insulin
• usedforType1DMatonset,maybeusedinType2DMatanypointintreatment
• routesofadministration:subcutaneousinjections,continuoussubcutaneousinsulininfusionpump,IV
infusion (regular insulin only)
• basal insulin – control blood sugar (produced by liver) during periods of fasting; slow onset of action,
lasts a long time
• bolusinsulin–requiredtodisposeofglucosefromameal;rapidonsetofaction,shortacting
• bolusinsulins:short-acting(Insulinregular),rapid-actinganalogue(Insulinaspart,Insulinglulisine,
Insulin lispro)
• basalinsulins:intermediate-acting(InsulinNPH),long-actinganalogue(Insulindetemir,glargine,
degludec)
• premixedinsulins(combinationofbasalandbolusinsulins),30/70insulinmixture,Humalog®mix25,
Endocrinology E9
Novorapid® mix 30
• estimatedtotaldailyinsulinrequirement:oftenstartwith0.3-0.5units/kg/d
Effects of Intensive Glucose Lowering in Type 2 DM: The ACCORD Trial
NEJM 2008;358:2545-2559
Study: Multicentre RCT.
Patients: 10,251 patients (mean age 62.2) with type 2 DM, and cardiovascular risk factors. Intervention: Intensive therapy targeting a HbA1c level of <6.0% or standard therapy targeting 7.0-7.9%.
Outcomes: First occurrence of nonfatal MI, nonfatal stroke, or death from CV causes.
Results: The intensive therapy arm was stopped early (3.5 yr vs. 5.6 yr planned) due to evidence
of increased mortality. There was no difference in primary outcome for either study arm. There was
a significant increase in all-cause mortality, CV mortality, nonfatal MI, and CHF in the intensive therapy group. There were increased rates of all hypoglycemic events, any nonhypoglycemic serious adverse events, fluid retention, and weight gain >10 kg, but lower systolic and diastolic blood pressure in the intensive therapy group. There
was an increased incidence of elevated ALT (>3x upper limit) and ACE drug use in the standard therapy group.
Conclusions: Intensive glucose lowering therapy in type 2 DM does not improve clinic outcomes and actually increases the risk of mortality with more adverse events compared to standard therapy. Additional research is required to discern the cause.
Effects of Intensive Blood Pressure Control in Type 2 DM: The ACCORD Trial
NEJM 2010;362:1575-1585
Study: RCT, unblinded with 4.7 yr of mean follow-up. Population: 4,733 patients with type 2 DM, risk factors for cardiovascular (CV) disease, systolic blood pressure (sBP) between 130-180 mmHg. Intervention: sBP control less than 120 mmHg (intensive) or 140 mmHg (standard).
Primary Outcomes: Major CV event (composite nonfatal MI, nonfatal stroke, or CV-related death). Results: Mean number of medications at 1 yr for intensive therapy was 3.4 (95% Cl 3.4-3.5) versus 2.1 (95% Cl 2.1-2.2) for standard therapy. There was a significant increase in all serious adverse events in the intensive treatment arm (3.3% vs. 1.27%, p=<0.001); especially bradycardia or arrhythmia (0.5% vs. 0.13%, p=0.02) and hyperkalemia (0.4% vs. 0.04%, p=0.01). There was no significant difference in primary outcomes in the two study arms, or all-cause mortality. There was a significant reduction in any stroke (0.32%/yr vs. 0.53%/yr, p=0.01) and nonfatal stroke incidences (0.30%/yr vs. 0.47%/yr, p=0.03) in the intensive therapy arm. Conclusions: Intensive BP lowering to less than 120 mmHg vs. 140 mmHg in patients with
type 2 DM and CV risk factors does not reduce major CV event risk reduction except for stroke events.
Pancreas
+
Kidneys
Muscle
insulin secretion
DPP-4 inhibitors
+
SGLT2 inhibitors
Defective
+ GLP-1 analogues
Ó urinary glucose secretion
+ Biguanide
Intestinal lipase inhibitor
e
Impaired glucose uptake
k
a
t
p
u
e
s
Ó
o
c
u
l
Ó
I
n
s
t
u
l
i
n
r
u
s
G
e
l
A
e
a
s
e
e
a
e
l
e
r
e
F
s
F
o
a
c
b
s
u
o
l
r
p
G
i
G
o
l
c
n
o
s
e
a
b
Biguanide
Liver
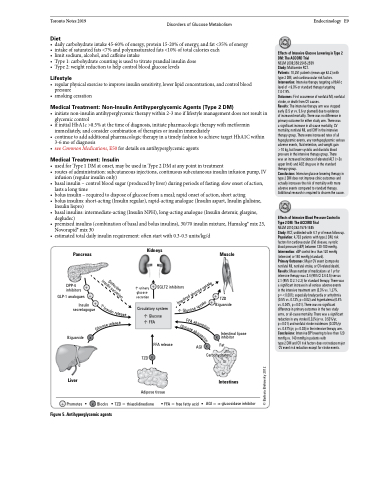
+ Promotes
x
x Carbohydrates
+ secretagogue
+
TZD
Insulin
Circulatory system Ó Glucose
ÓFFA
FFA release
s
o
r
p
t
i
o
n
© Barbara Brehovsky 2012
Figure 5. Antihyperglycemic agents
x
Blocks
Adipose tissue
TZD = thiazolidinedione FFA = free fatty acid
TZD x
AGI
x
AGI = α-glucosidase inhibitor
Fat
Intestines
