
Page 76 - TNFlipTest
P. 76
C8 Cardiology and Cardiac Surgery
Approach to ECGs Toronto Notes 2019
• “typical”sequentialchangesofevolvingMI
1. hyperacute T waves (tall, symmetric T waves) in the leads facing the infarcted area, with or without
ST elevation
2. ST elevation (injury pattern) in the leads facing the infarcted area
◆ usually in the first hours post infarct
◆ in acute posterior MI, there is ST depression in V1-V3 (reciprocal to ST elevation in the
posterior leads, that are not recorded in the standard 12-lead ECG) - get a 15-lead ECG
3. significant Q waves: >40 msec or >1/3 of the total QRS and present in at least 2 consecutive leads in
the same territory (hours to days post-infarct)
◆ Q waves of infarction may appear in the very early stages, with or without ST changes
◆ non-Q wave infarction: there may be only ST or T changes despite clinical evidence of infarction
4. inverted T waves (one day to weeks after infarction) • completedinfarction
■ abnormal Q waves (Q waves may be present in leads III and aVL in normal individuals due to initial septal depolarization)
■ duration >40 msec (>30 msec in aVF for inferior infarction)
■ Q/QRS voltage ratio is >33%
■ present in at least 2 consecutive leads in the same territory
■ abnormal R waves (R/S ratio >1, duration >40 msec) in V1 and occasionally in V2 are found in
posterior infarction (usually in association with signs of inferior and/or lateral infarction)
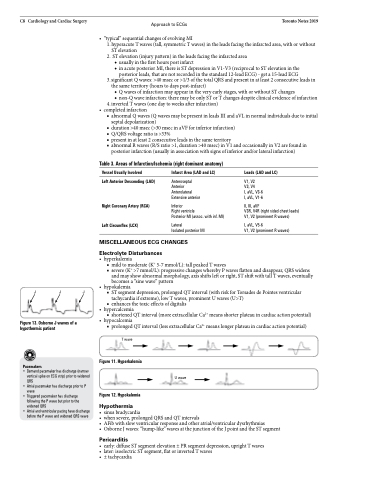
JJJ
Figure 13. Osborne J waves of a hypothermic patient
Pacemakers
• Demand pacemaker has discharge (narrow vertical spike on ECG strip) prior to widened QRS
• Atrial pacemaker has discharge prior to P wave
• Triggered pacemaker has discharge following the P wave but prior to the widened QRS
• Atrial and ventricular pacing have discharge before the P wave and widened QRS wave
• hyperkalemia
■ mild to moderate (K+ 5-7 mmol/L): tall peaked T waves
■ severe (K+ >7 mmol/L): progressive changes whereby P waves flatten and disappear, QRS widens
and may show abnormal morphology, axis shifts left or right, ST shift with tall T waves, eventually
becomes a “sine wave” pattern • hypokalemia
■ ST segment depression, prolonged QT interval (with risk for Torsades de Pointes ventricular tachycardia if extreme), low T waves, prominent U waves (U>T)
■ enhances the toxic effects of digitalis • hypercalcemia
■ shortened QT interval (more extracellular Ca2+ means shorter plateau in cardiac action potential) • hypocalcemia
■ prolonged QT interval (less extracellular Ca2+ means longer plateau in cardiac action potential)
Table 3. Areas of Infarction/Ischemia (right dominant anatomy)
Vessel Usually Involved
Left Anterior Descending (LAD)
Right Coronary Artery (RCA) Left Circumflex (LCX)
Infarct Area (LAD and LC)
Anteroseptal Anterior Anterolateral Extensive anterior
Inferior
Right ventricle
Posterior MI (assoc. with inf. MI)
Lateral
Isolated posterior MI
Leads (LAD and LC)
V1, V2
V3, V4
I, aVL, V3-6 I, aVL, V1-6
II, III, aVF
V3R, V4R (right sided chest leads) V1, V2 (prominent R waves)
I, aVL, V5-6
V1, V2 (prominent R waves)
MISCELLANEOUS ECG CHANGES
Electrolyte Disturbances
T wave
Figure 11. Hyperkalemia
Figure 12. Hypokalemia
Hypothermia
U wave
• sinusbradycardia
• whensevere,prolongedQRSandQTintervals
• AFibwithslowventricularresponseandotheratrial/ventriculardysrhythmias
• OsborneJwaves:“hump-like”wavesatthejunctionoftheJpointandtheSTsegment
Pericarditis
• early:diffuseSTsegmentelevation±PRsegmentdepression,uprightTwaves • later:isoelectricSTsegment,flatorinvertedTwaves
• ±tachycardia
